Chart of the month

Immediate services & supplies opportunities exist primarily around producing assets and new onshore production from Middle East projects.
 
This month’s chart comes from Rystad Energy’s UCube database and shows average breakeven prices and remaining resource volumes for various producing and non-producing assets across the globe. The chart provides some insight into where future upstream investments are likely to go. With an average breakeven of $23/bbl and nearly 900 billion bbl of remaining resources, operators everywhere are expected to primarily put capital towards projects that are already up and running. This signals opportunities for water services, equipment and technology providers that can contribute to maintenance and refurbishment plans at existing fields.
 
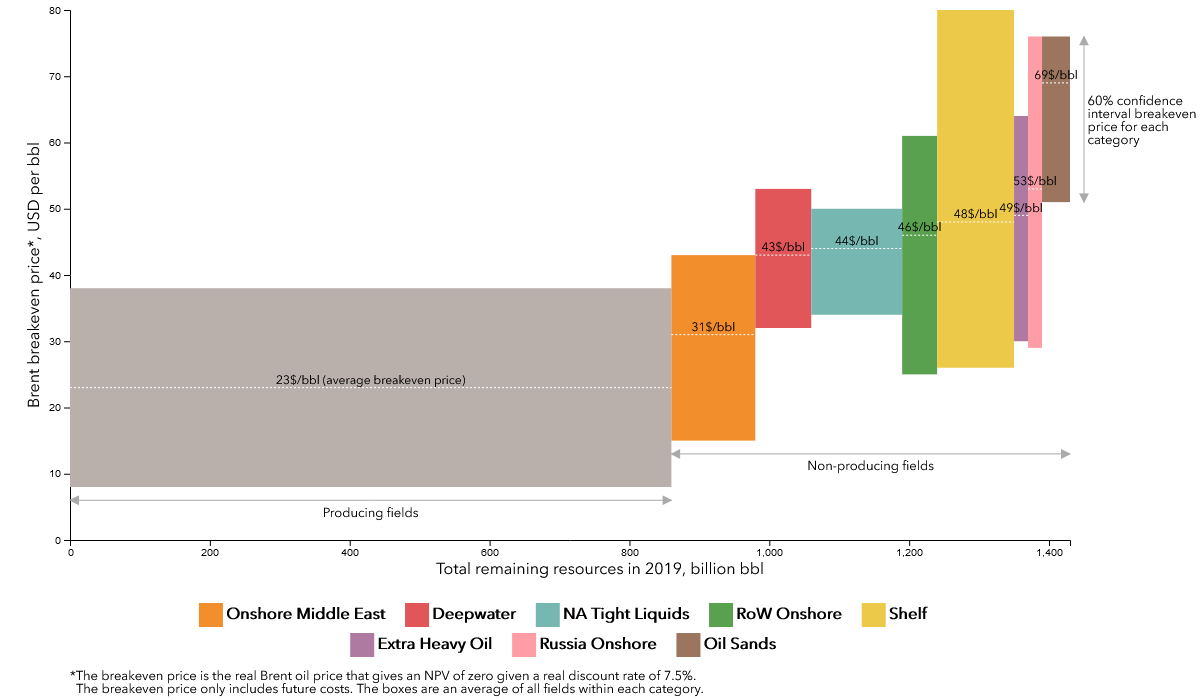
According to Rystad, the average breakeven price for all unsanctioned projects stands at approximately $50/bbl – around 35% lower than prior to the 2014 oil price downturn, but still above today’s Brent price of $47.50/bbl. Much of breakeven price compression can be attributed to the transformation of the oilfield services sector (including companies in the water space), which was forced to significantly raise operational and cost efficiencies to survive the 2014 downturn. This is especially true for the tight oil market in which a tough 2020 is expected to continue driving down supply chain and services pricing.
 
To read Rystad’s analysis of breakeven prices and learn more about the methodology behind the chart, click here.